Pages

Sunday, February 19, 2012

Support & Resistance Discussion

Support & Resistance (S/R) are areas, or ranges, they are rarely exact price points.
The lower time frames will more often respect exact prices. 
For example M1, M5, M15, M30

The larger time frames will respect general areas, ranges of price, NOT exact prices. 
For example H1, H4, D1, W1, MN

The concept to understand is very simple really.
Support is the bottom, this area is where the Buyers out numbered the Sellers and pushed price UP, or Higher. They will Defend that price area.

Resistance is the top, this area is where the Sellers out numbered the Buyers and pushed price DOWN, or Lower. They will Defend that price area.

One main thing to monitor is the behavior of price related to where it closes.
Does the candles in your timeframe begin to close above or below S/R?
(see image)
A-Resistance Established
B-Support Established at a Swing Low
C-Candle Closes above Resistance (Point A)
D-Price still flows up and down, it pulls back; however, not as low. (Stays above Point B)

E-Price Breaks to New Highs.


Saturday, February 11, 2012

Recommended Broker http://www.arrowfieldtrading.com/

Josh Lampel is your broker to connect with.
He is very focused on customer service.
see http://www.arrowfieldtrading.com/ for more details.
Tell Josh "TheGreedyPig" sent you.

Oink Oink
TheGreedyPig

Friday, February 10, 2012

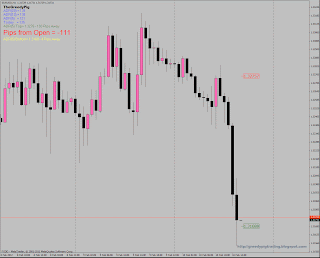
Indicator TheGreedyPig ADR v3

I took an indicator and modified it to add some whistles and bells.

Top Left of chart:
ADR(20) = XXX
ADR(10) = XXX
ADR(5)  = XXX
Today   = XXX
ADR Top = xxxx - xx Pips Away [This will turn Yellow if within 20 Pips]
Pips from Open = xx [this will change color >20 is Green, < -20 is RED Less than 20 is Yellow]
ADR Bottom = xxxx - xx Pips Away [This will turn Yellow if within 20 Pips]
On the chart at the current candle:
ADR Top Price Box on CHART above Price
ADR Bottom Price Box on Chart below Price
As Price makes new highs/lows the Price boxes adjust right on the chart so you always know where the ADR(5) Top and Bottom is.
Screenshot:

Wednesday, February 8, 2012

Support Resistance and Trendlines

Notice here how there is Horizontal Support (S) and Resistance (R).
The same exact rules apply to rising/falling Support & Resistance Trendlines.
See how Price Respects the falling Trendline.


 "TheGreedyPig"

Foundation of Trading

Hello, the best way to explain what I see on charts is I notice when:
1- horizontal Resistance line can draw across candles and it has 2-5 touch points, High/Open/Close etc that is Resistance.

2-horizontal Support line can draw across candles and it has 2-5 touch points, Low/Open/Close etc that is Resistance.

Watch lower timeframes M5, M15 to see how the traders, humans, will buy and sell in this range/channel for a bit, then it can't continue, see patterns for breakouts, then it will most often retest that Support/Resistance line you drew...Amazing and simple...once you really get this down you trade that behavior.
Learn the behavior of price..then trade it...

Good Luck
Priceless Quote:
"Support once Established, will often flip to Resistance once broken, AND Resistance once Established, will often flip to Support once broken"
See Image "S" = Support "R" = Resistance

Monday, February 6, 2012

Welcome to GreedyPigTrading

Just got started with GreedyPigTrading.
Here is my YouTubeChannel:  http://www.youtube.com/user/GreedyPigTrading
Here is my Facebook Account Name: TheGreedy Pig
"TheGreedyPig" is a Tradency Mirror Trading Strategy.  We are in the Audit phase and look to open our Strategy to the public in March 2012.
Look for great information on Mirror Trading Services, How to use Tradency, and how to succeed in Trading.

TheGreedyPig